Chart Widget
A widget that displays a chart
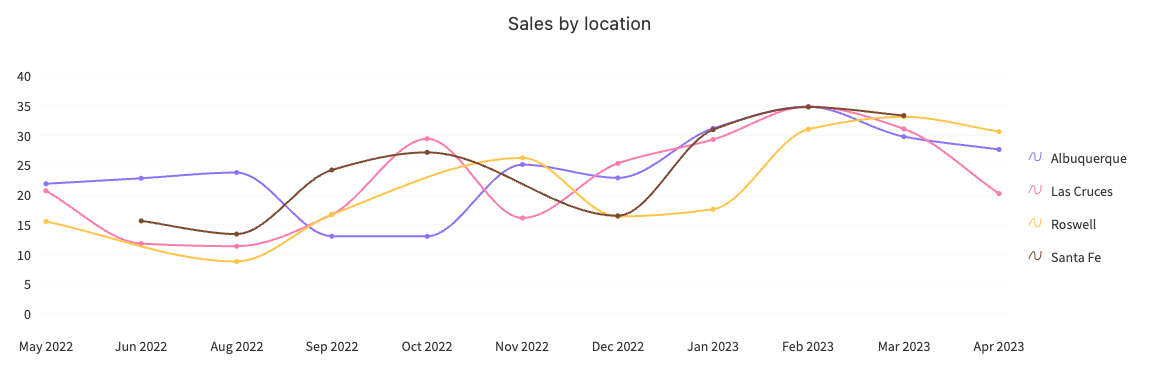
A chart widget in Lemonado is a visual tool that allows you to display your data in the form of various types of charts, such as bar charts, line charts, pie charts, etc. It helps in making the data more understandable and visually appealing, enabling you to spot trends, patterns, and outliers easily. You can use it to represent your data graphically for presentations, reports, or just to get a clearer picture of what your data is telling you.

Add chart widget
